
 Zoe Nora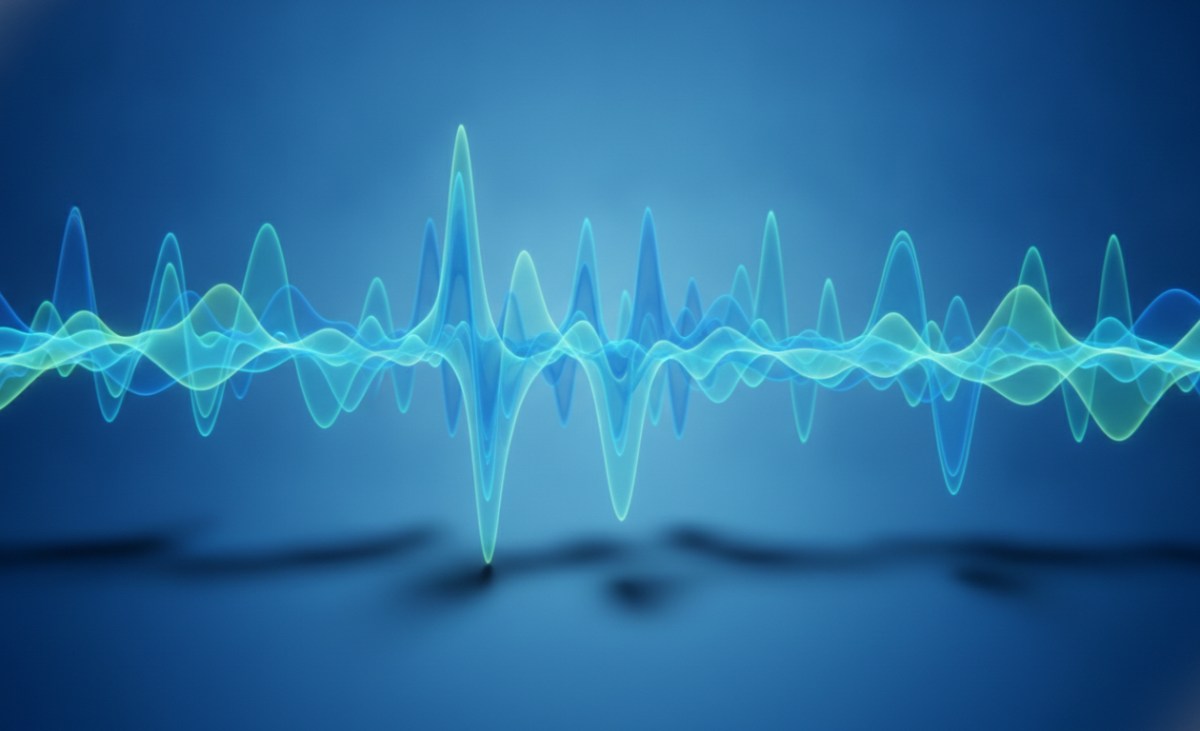
Did you know that over 90% of professional video editors use visual signal analysis to meet strict broadcast standards? This data helps ensure that on-screen images match creative intent.
At its core, a waveform shows how a signal changes over time. It turns complex data into a visual graph that tracks exposure levels, audio peaks, and medical heart rhythms with absolute precision.
Understanding this tool matters to people in technical fields. Whether you balance light on a film set or analyze electronic pulses, this visual language supports informed decisions. We use this data to connect raw input with professional output and keep production consistent across every stage.
Key Takeaways
- Visualizing signals helps maintain broadcast-legal exposure standards.
- These tools provide objective data that eyes alone cannot capture.
- They are vital for both on-set monitoring and post-production workflows.
- Applications extend beyond video to audio, medicine, and engineering.
- Learning to read these graphs improves overall technical accuracy.
What is a Waveform?
Every sound we hear and each electrical pulse we measure follows a path called a waveform. It shows, through images or math, how a signal changes over time. On a screen or graph, we see energy moving through a medium.
When we experience audiophile quality sound, we interact with moving air molecules. This soundwave carries the music we enjoy. An electrical signal uses voltage changes in a circuit, and both use a steady wave pattern for timing, intensity, and repetition.
Definition and Importance
A waveform is a map of change. It helps engineers and musicians see invisible forces and refine audio signals with great accuracy. Without this visual aid, understanding complex sound would be nearly impossible.
By studying the wave pattern, we can spot distortion or clipping before we hear it. This control separates professional audio production from amateur work. It keeps every soundwave clean, balanced, and true to its original source.
Types of Waveforms
We can group these signals by shape and behavior. Some repeat simply, while others are complex and irregular. These groups help us choose tools for signal processing and sound design.
| Waveform Category | Primary Characteristic | Common Application |
|---|---|---|
| Sine Wave | Pure, smooth oscillation | Audio testing |
| Square Wave | Abrupt, binary shifts | Digital synthesis |
| Sawtooth Wave | Linear rise and fall | Rich, harmonic textures |
| Triangle Wave | Soft, angular peaks | Musical instrument emulation |
| Complex Wave | Irregular, layered data | Real-world audio recording |
We also encounter pulse, step, and asynchronous signals. Each waveform has a special purpose in electronics and acoustics. Mastering these patterns deepens our appreciation for technology that powers modern listening experiences.
Understanding Waveform Shapes
Signal geometry helps us understand how information travels through analog and digital systems. Every signal we use follows a specific geometric wave pattern that shapes its behavior and purpose. Identifying these shapes helps us control equipment and improve sound quality.
Sine Wave
The sine wave is nature’s most basic smooth oscillation. It follows a continuous curve without sharp edges or sudden jumps. Electricity from wall outlets follows this wave pattern, providing steady power.
Square Wave
A square wave switches instantly between high and low states. It creates a box-like shape instead of a smooth curve. This shape is essential for modern computing.
Because it uses two fixed values, it forms a digital waveform in many electronic circuits. You can enjoy high-res streaming on your favorite devices by understanding these signal structures.
Triangle Wave
Triangle waves sit between sine and square waves. They use linear ramps that change at a steady rate, creating sharp peaks. Their predictable rhythm makes them useful for synthesis and testing.
To compare these shapes, consider these main features:
- Sine Wave: Smooth, natural, and continuous; common in power grids.
- Square Wave: Rapid switching; the standard for a digital waveform.
- Triangle Wave: Constant, linear ramps; ideal for precise signal modulation.
Recognizing these shapes helps us find problems in audio production and electronics. Analog gear and complex software still use these basic forms for signal processing.
Key Components of a Waveform
To master waveform analysis, first identify the basic parts that shape every signal. These traits help us understand how information moves through electronic circuits and audio systems.
Amplitude
Amplitude shows the magnitude or strength of a signal at any moment. It measures the wave’s height from its center point to its peak. A higher amplitude usually means a stronger signal, such as louder sound or higher circuit voltage.
Frequency
Frequency shows the repetition rate of a waveform in cycles per second, or Hertz (Hz). It tells us how quickly the signal oscillates over time. Many cycles in one second mean high frequency, which sounds like higher pitch or faster digital data.
Phase
Phase shows the timing relationship between two or more signals with the same frequency. It shows a wave’s position in its cycle at a specific time. Aligning the phases of different signals can create constructive interference, which strengthens the output significantly.
Complex signals often combine several shapes to carry data, using subtle changes in these three core properties. With precise waveform analysis, engineers and producers can adjust these variables for specific results. Mastering these components is the first step toward controlling signal-based technology.
How Waveforms are Generated
Waveforms are made through careful physical and digital processes. In labs and software design, precise methods create signals that drive our technology.
Electrical Signals
At the center of signal creation is a waveform generator. It acts as an oscillator, producing controlled electrical signals that change over time. Engineers change voltage to create stable sine, square, and triangle waves for testing and measurement.
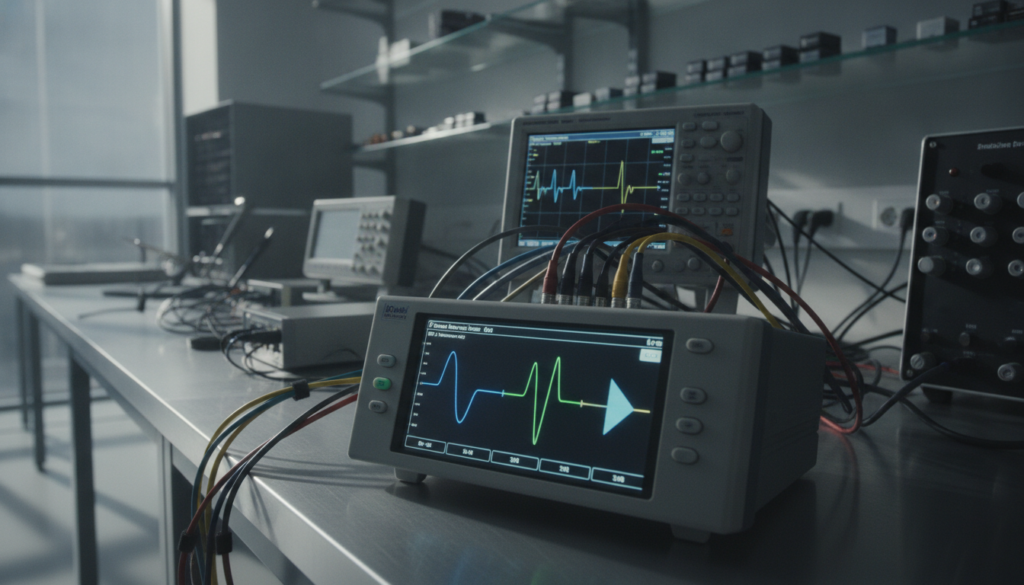
These instruments set a signal’s exact frequency and amplitude. The main benefit is Consistency, which helps electronic components behave predictably during rigorous testing.
Sound Waves
In acoustics, we can see how a soundwave behaves. Changes in electrical voltage directly move air molecules.
Changing voltage pushes and pulls a speaker cone, creating pressure changes we hear as sound. This process forms the basis for capturing and reproducing high-fidelity audio in modern recording studios.
Visual Representations
We use visual traces to map these invisible forces over time. An audio signal appears on an oscilloscope, showing its exact shape as it travels through a circuit.
These tools reveal pulses and pulse trains that carry critical digital information. By watching these patterns, we can troubleshoot complex systems and keep data transmission accurate and efficient.
| Signal Type | Primary Use | Generation Method |
|---|---|---|
| Sine Wave | Audio Testing | Analog Oscillator |
| Square Wave | Digital Logic | Switching Circuit |
| Pulse Train | Data Transmission | Clock Generator |
The Role of Waveforms in Audio
Audio professionals rely on the visual shape of a soundwave for key creative decisions. Peaks and valleys in an audio signal can reveal problems that ears alone may miss. This visual feedback helps studios achieve professional results.
Music Production
In music production, a waveform maps the balance between instruments. We study amplitude to keep volume steady throughout the arrangement. Timing is easy to check by aligning transients across multiple tracks.
When mixing a song, we use visual cues to prevent clipping. Peak monitoring helps us apply compression and control the dynamics. That process gives the final output a polished, balanced sound on all playback systems.
Noise Reduction
Effective signal processing cleans recordings by targeting specific unwanted frequencies. A waveform can reveal clicks, pops, and hums as clear irregularities. These visual clues help isolate background interference without harming the main performance.
We often use spectral editing tools to zoom in on problem areas. By removing noise carefully, we preserve the original recording’s integrity. This vital step restores vintage audio and cleans field recordings.
Sound Design
Sound design lets us explore the basic nature of an audio signal. By changing a wave’s shape, we create new textures and timbres for synthesizers. With sine, square, or triangle waves, the visual form helps predict the sound’s harmonic content.
Advanced signal processing lets us layer these shapes into complex sonic landscapes. We adjust phase and frequency so sounds fit perfectly within a mix. Mastering the soundwave turns abstract mathematical data into an engaging, emotional listening experience.
Waveforms in Electronics
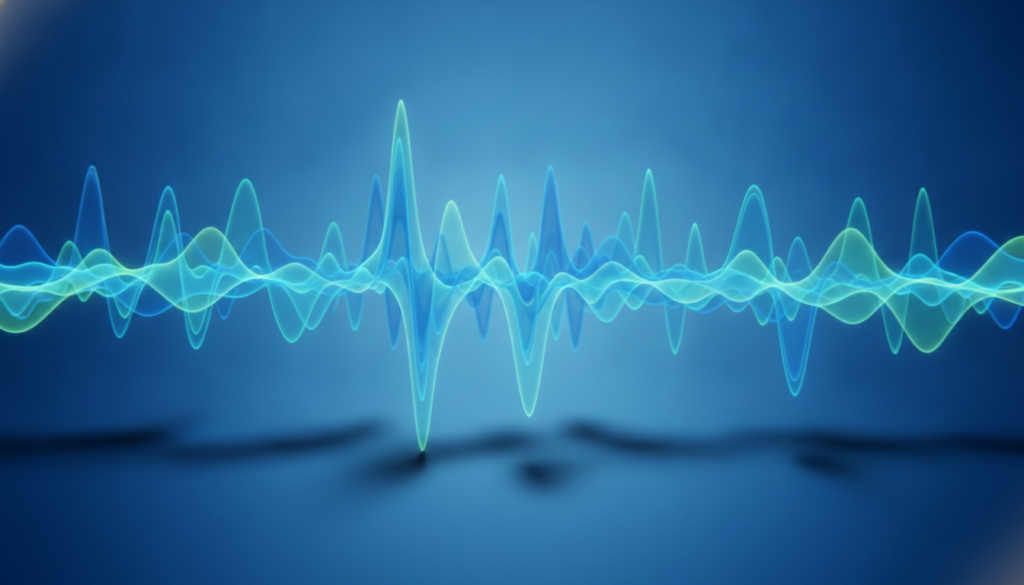
From timing circuits to data transmission, waveforms support modern electronics. These electrical patterns manage timing, control hardware, and enable precise measurements. Using a digital waveform, engineers help components communicate in perfect sync.
Signal Processing
Signal processing changes electrical signals to improve quality or reveal useful information. When we use a waveform generator, we create patterns that test circuit responses to different inputs. This process removes unwanted noise and improves data performance.
Effective processing often means converting raw analog data into a computer-ready format. We achieve this through several key steps:
- Filtering: Removing unwanted frequencies from the signal.
- Amplification: Increasing the strength of a weak signal for better detection.
- Conversion: Changing analog inputs into a digital waveform for processing.
Modulation Techniques
Modulation encodes information on a carrier signal by changing its properties. Changing amplitude, phase, or frequency sends data across long distances through radio or fiber optics. A high-quality waveform generator is essential for testing these complex communication links.
In digital systems, square waves and pulse trains often coordinate operations. These signals act like a computer heartbeat, telling each component when to execute a command. Precise timing makes modern television, radio, and internet systems possible.
“The ability to manipulate waveforms is the foundation of all electronic communication and control systems.”
By mastering these techniques, we keep expanding what our devices can achieve. Whether it is through signal processing or advanced modulation, studying waveforms remains vital to technological progress.
Applications of Waveforms in Medicine
Waveform technology supports modern clinical diagnosis and patient care. It captures subtle electrical changes, helping medical professionals assess a patient’s physical state. Access to high-quality wave data supports better clinical research and patient outcomes.
Diagnostic Imaging
Diagnostic imaging uses controlled energy pulses to create detailed views inside the body. Advanced signal processing helps MRI and ultrasound machines turn raw echoes or magnetic resonance into clear, useful images. These systems use wave timing and intensity to tell different tissue types apart.
In X-ray technology, controlled radiation pulses pass through tissues effectively. Clinicians analyze the resulting patterns to find abnormalities with high accuracy. This process keeps diagnostic tools safe and effective for routine screenings.
Therapeutic Uses
Beyond imaging, waveform principles deliver life-saving treatments to the heart and nervous system. Pacemakers and defibrillators use specific electrical pulses to control heart rhythms. These devices interpret real-time signal processing inputs to decide when intervention is needed.
Reliable therapeutic devices depend on accurate underlying wave data. When these systems work correctly, they provide steady support that stabilizes patient health. We continue improving how these technologies meet individual needs through software algorithms.
| Medical Application | Primary Waveform Role | Clinical Benefit |
|---|---|---|
| Diagnostic Ultrasound | Echo reflection analysis | Non-invasive imaging |
| Cardiac Pacemaker | Electrical pulse timing | Heart rhythm regulation |
| Digital X-Ray | Radiation pulse modulation | High-resolution diagnostics |
| Patient Monitoring | Continuous signal tracking | Early warning detection |
Analyzing Waveforms
Mastering waveform analysis means using tools that make hidden signals visible. We use advanced hardware to decode each audio signal in our daily work. These patterns reveal system performance and signal integrity.
Tools for Analysis
The oscilloscope is the most basic tool in our kit. Modern digital phosphor oscilloscopes stand out because they offer intensity grading. This feature shows how often a specific waveform appears and reveals hidden faults standard displays may miss.
Precision in measurement is the bridge between a theoretical design and a functional reality in the world of signal processing.
Beyond basic oscilloscopes, we use special software to process wave data. These tools let us inspect frequency components and timing jitter closely. Together, precise hardware and flexible software give us a full view of any signal.
Visual Representation Techniques
Effective waveform visualization helps us interpret complex data streams. For example, eye patterns show digital transitions layered across one unit interval. This method helps us find noise or signal loss before it harms the whole system.
Another advanced method uses constellation diagrams. These diagrams map digitally modulated signals through the carrier wave’s phase and amplitude. These visual maps help us judge transmission quality and stability quickly.
| Analysis Tool | Primary Function | Best Use Case |
|---|---|---|
| Standard Oscilloscope | Time-domain viewing | General signal monitoring |
| Digital Phosphor Scope | Intensity grading | Detecting intermittent faults |
| Eye Pattern Display | Timing analysis | Digital data integrity |
| Constellation Diagram | Modulation mapping | Communication systems |
Ultimately, the right technique depends on your project’s specific needs. Whether troubleshooting an audio signal or improving a high-speed data link, steady waveform analysis remains the gold standard for success. Always prioritize clarity and accuracy when interpreting collected wave data.
Waveforms in Animation and Graphics
We often overlook how mathematical wave patterns shape the complex visuals on today’s screens. Applying a digital waveform to graphic design helps creators move beyond manual keyframing. This method automates intricate visual behaviors that would be impossible to animate by hand.
Motion Graphics
In motion graphics, procedural animation uses these signals to control movement. Designers use a specific wave pattern to set the speed and rhythm of transitions. A sine wave creates natural easing, while a sawtooth wave makes a sharp, repeating reset for rhythmic pulses.
This method of waveform visualization helps artists connect data with visual properties. Linking a signal to an object’s position or rotation creates perfectly smooth, infinite loops. These mathematical foundations keep animations consistent regardless of the frame rate.
Visual Effects
Visual effects artists often use these signals to control textures and lighting. A digital waveform can control a glow’s intensity or a scene’s flicker frequency. Constant-rate ramps in triangle waves create controlled scans or precise, intentional linear transitions.
Furthermore, waveform visualization provides a powerful tool for distortion effects. Modulating pixel displacement with a wave can simulate heat haze, water ripples, or glitch art. These techniques turn static images into dynamic, living environments through signal mathematics.
The Future of Waveform Technology
We are entering an era when signal tools must work as fast as the signals they observe. As data transmission speeds rise, the electrical pulses behind them become far more complex. This change requires new ways to capture and interpret information in real-time environments.
Innovations and Trends
Modern engineering is moving toward smarter, more independent systems. A high-performance waveform generator must now work smoothly with intelligent software. These systems no longer only observe data; they also help diagnose problems.
Automated interpretation is the industry’s next major milestone. With machine learning, engineers can identify anomalies once hidden from the human eye. This move toward automated monitoring keeps systems stable as signal density reaches record highs.
“The future of measurement lies not in seeing more data, but in understanding the hidden patterns within the noise.”
Potential Advancements
The next generation of waveform analysis will likely depend on deeper artificial intelligence integration. We expect tools that move beyond static snapshots and provide continuous, predictive insights. These advances will change how we handle complex signal environments.
Future developments will likely focus on these key areas:
- Enhanced waveform visualization techniques that render high-speed data in three dimensions.
- Advanced constellation diagrams that adapt in real-time to changing environmental interference.
- Next-generation hardware that allows a waveform generator to simulate increasingly complex signal behaviors.
Ultimately, the goal is to improve waveform analysis until it detects subtle signal changes before they cause system failures. By combining better hardware with sophisticated software, we will gain unprecedented control over the digital world. This progress will help us build faster, more reliable networks for the future.
Conclusion: The Significance of Understanding Waveforms
Grasping the core principles of a Waveform helps us decode the hidden language of our modern world. We now see how shape, amplitude, frequency, and phase combine to create signals that power our daily lives.
Interpreting complex wave data helps us solve problems in fields from medicine to music production. Professionals rely on this knowledge to ensure precision in every project they undertake.
Tools like a Tektronix Waveform monitor remain vital for those who demand accurate visual output. These devices provide the clarity needed to manage exposure and color balance with absolute confidence.
We encourage you to apply these concepts to your own creative or technical work. Experimenting with different signal types will sharpen your skills and deepen your understanding of how energy moves through our systems.
What specific challenges are you facing with your current signal analysis? Share your experiences or ask questions to keep the conversation moving forward.